File:2408.14837.figure.7.1.png
Size of this preview: 800 × 494 pixels. Other resolution: 1,264 × 781 pixels.
Original file (1,264 × 781 pixels, file size: 57 KB, MIME type: image/png)
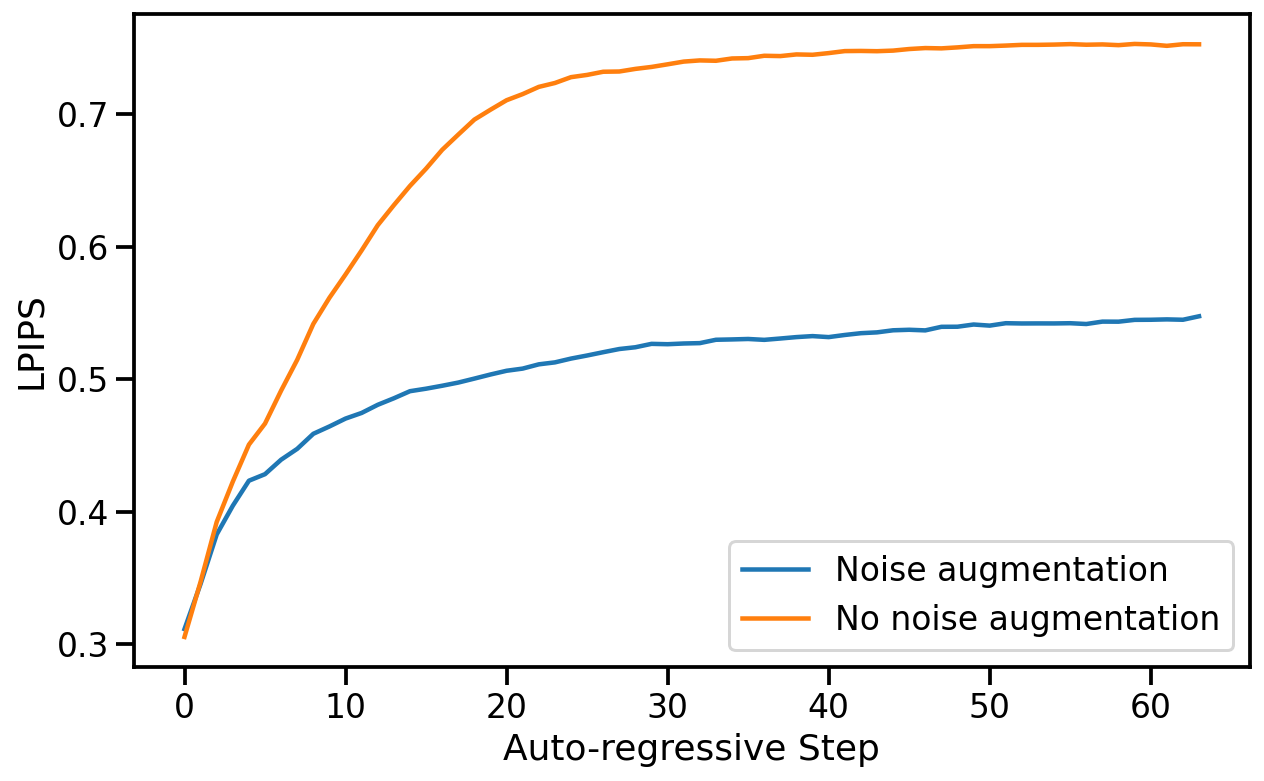
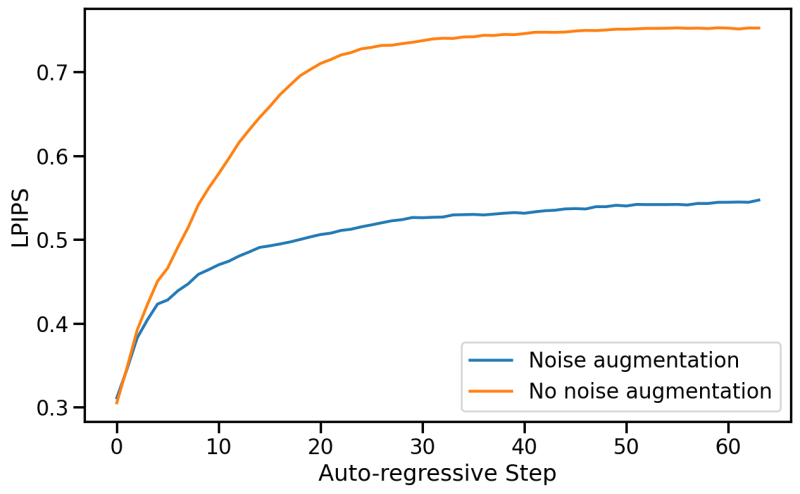
Figure 7: Impact of Noise Augmentation. The plots show average LPIPS (lower is better) and PSNR (higher is better) values for each auto-regressive step. When noise augmentation is not used quality degrades quickly after 10-20 frames. This is prevented by noise augmentation.
File history
Click on a date/time to view the file as it appeared at that time.
| Date/Time | Thumbnail | Dimensions | User | Comment | |
|---|---|---|---|---|---|
| current | 07:00, 29 August 2024 | | 1,264 × 781 (57 KB) | FelipeArias (talk | contribs) |
You cannot overwrite this file.
File usage
The following 7 pages use this file:
- Diffusion Models Are Real-Time Game Engines
- Diffusion Models Are Real-Time Game Engines/en
- Diffusion Models Are Real-Time Game Engines/es
- Diffusion Models Are Real-Time Game Engines/zh
- Translations:Diffusion Models Are Real-Time Game Engines/70/en
- Translations:Diffusion Models Are Real-Time Game Engines/70/es
- Translations:Diffusion Models Are Real-Time Game Engines/70/zh